HYPE price tracks toward $20 as bullish pattern signals major comeback

HYPE is flashing strong bullish signals as it nears a breakout from a falling wedge pattern.
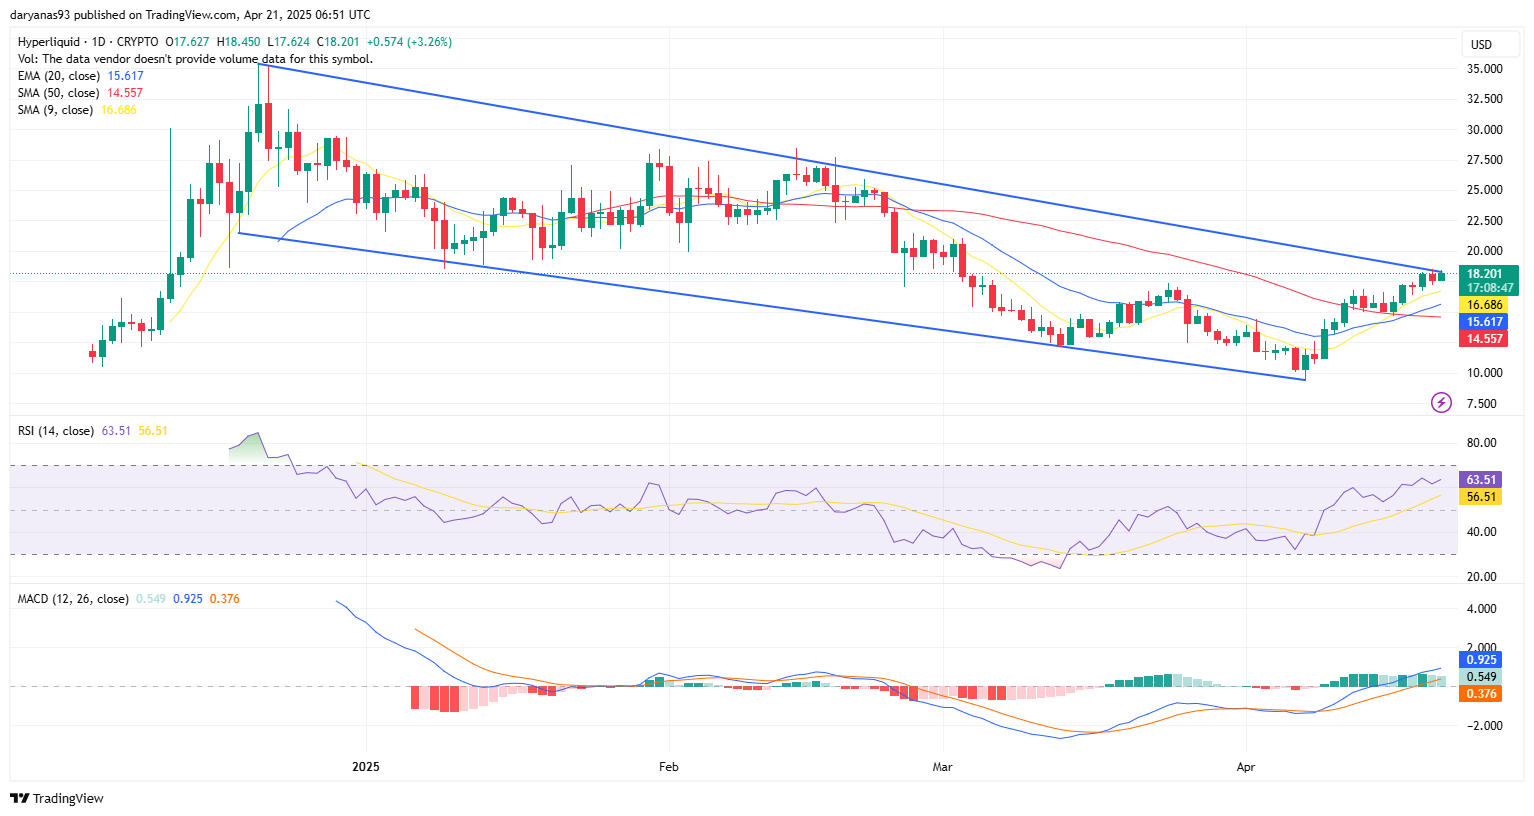
Hyperliquid ( HYPE ) is showing strong bullish momentum as it’s currently on the verge of breaking out of the falling wedge formation and trading above the key moving averages — including 20-day Exponential Moving Average, 9-day Simple Moving Average, and 50-day Simple Moving Average.
After reaching its all-time high of $35.02 on 21 December, HYPE price price entered a downtrend, carving out a falling wedge formation. The price bottomed near $9 on April 7, touching the wedge’s lower trendline before then bouncing and testing the previous resistance at around $17.30. Since then, it has climbed above all major moving averages, including SMA 9, EMA 20 and, SMA 50. The 20 EMA and 50 SMA just had a bullish cross, signaling trend reversal.
The RSI is currently sitting at 63.51, indicating that bullish momentum is picking up. MACD also shows bullish crossover, with both lines above zero.
 Source: TradingView
If HYPE holds above $18, the next major resistance lies at the psychological $20 level, which also aligns with the zone where the price was supported multiple times throughout January and February until it broke lower in early March.
Once $20 is cleared, the next key resistance to watch is around $26 — where the upper trendline meets with the lower high that formed in mid February.
If the wedge breakout is confirmed and the price holds above $18 with increasing volume, a longer-term target of $35 becomes possible — aligning with the origin of the upper trendline of the falling wedge.
The bullish thesis would be invalidated if HYPE fails to hold above the $18 support zone, especially on increasing sell volume. A breakdown back below the 50-day SMA and 20-day EMA would suggest a loss of momentum and could open the door for a retest of the $17.30 level or even a move back toward the wedge’s lower trendline near $12–$13.
Disclaimer: The content of this article solely reflects the author's opinion and does not represent the platform in any capacity. This article is not intended to serve as a reference for making investment decisions.
You may also like
Worldcoin (WLD) Surges Amid Legal Challenges and Speculation on OpenAI Integration
Ethereum Boosts Altcoin Surge with Significant Rally
In Brief Ethereum surged nearly 20%, fueling a broader altcoin rally. Technical indicators show strength, yet new altcoin season debate persists. Growth in ETH and altcoins challenges Bitcoin's dominance amid market shifts.

Ethereum Outshines Bitcoin with Impressive Surge
In Brief Ethereum's price surged past $1,900, outpacing Bitcoin significantly. Institutional investments drove Ethereum's substantial upswing post-Pectra update. Potential record surge may push Ethereum above $6,000, exciting cryptocurrency enthusiasts.

Crypto Boom: Bitcoin Surges Amid Dramatic Market Shifts
In Brief Bitcoin has surged past $103,000, with altcoins seeing noteworthy gains. Strategists recommend seizing buying opportunities during altcoin corrections. Anticipated events could bring further volatility to crypto markets.