Stellar (XLM) Dives 5% With Indicators Suggesting More Losses

Stellar faces sharp declines as bearish momentum builds, with technicals pointing to $0.22 and $0.20 as critical support levels. Momentum and capital outflows suggest deeper losses ahead unless bulls step in fast.
Stellar (XLM) is down more than 5% on Thursday, with its market capitalization dropping to $8 billion. XLM technical indicators are flashing strong bearish signals, suggesting continued downward momentum that could test critical support levels around $0.22.
While a reversal scenario remains possible with resistance targets at $0.27, $0.29, and $0.30, such an upside move would require a substantial shift in market sentiment.
XLM RSI Shows Sellers Are In Control
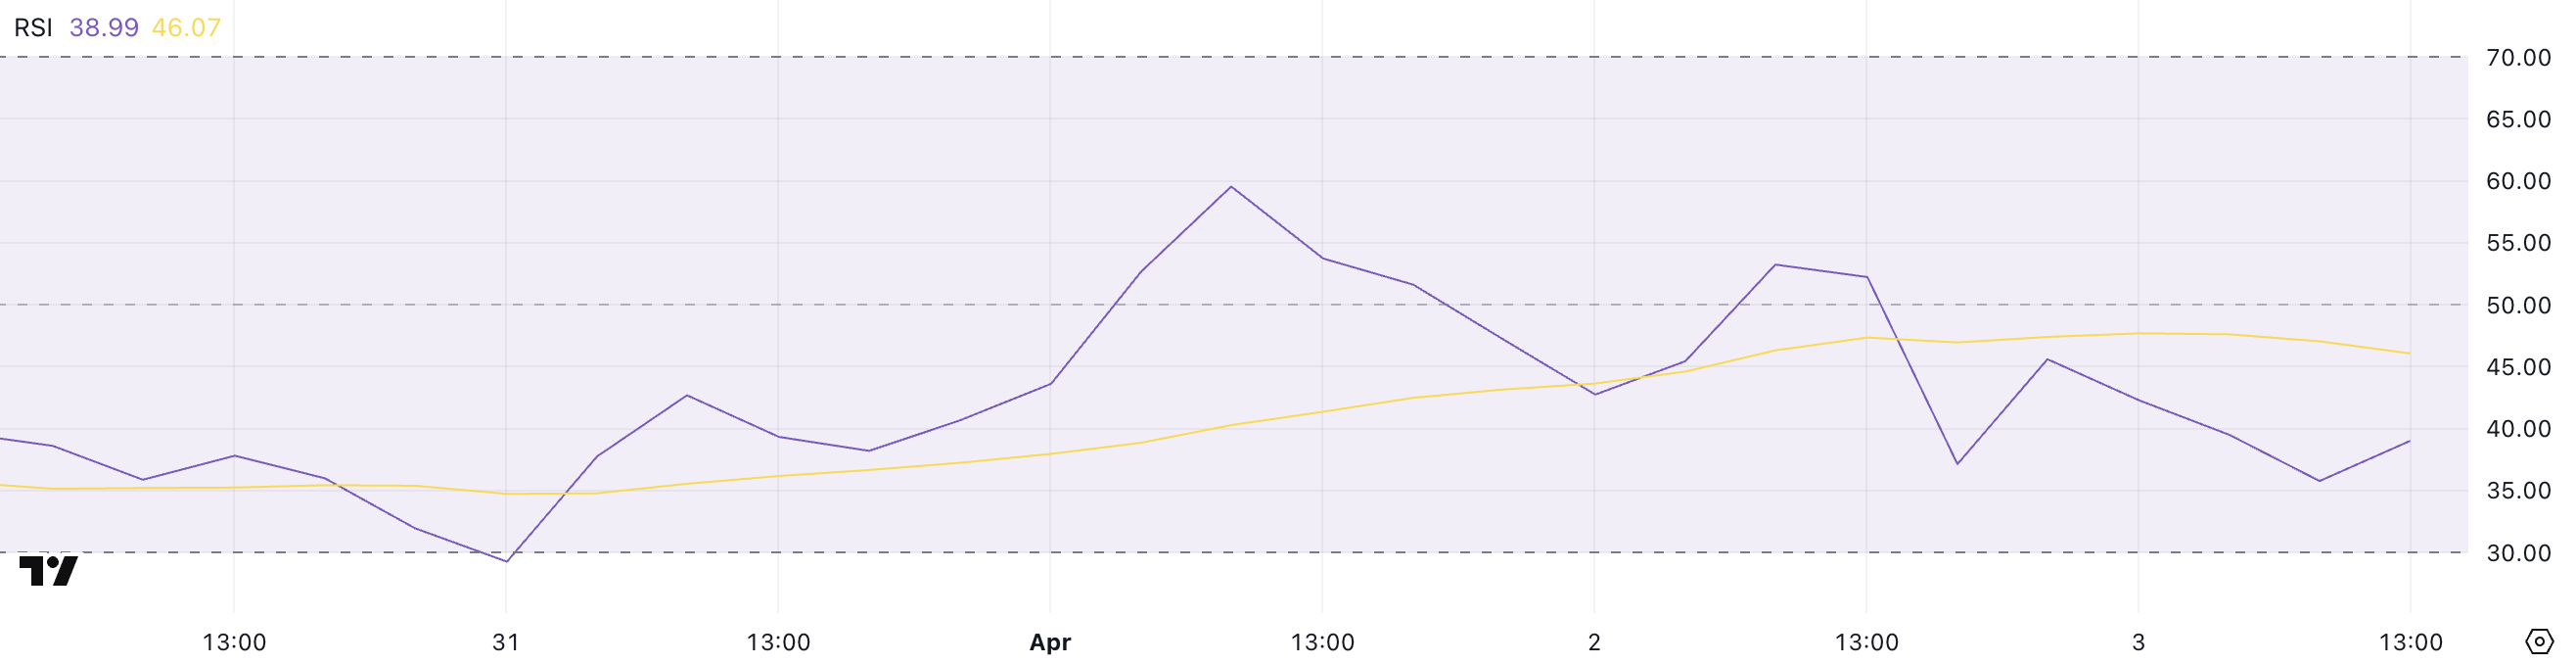
Stellar’s Relative Strength Index (RSI) has dropped sharply to 38.99, down from 59.54 just two days ago—signaling a notable shift in momentum.
The RSI is a widely used momentum oscillator that measures the speed and magnitude of recent price changes, typically ranging between 0 and 100.
Readings above 70 suggest overbought conditions, while levels below 30 indicate oversold territory. A reading between 30 and 50 often reflects bearish momentum but is not yet extreme enough to trigger an immediate reversal.
 XLM RSI. Source:
TradingView.
XLM RSI. Source:
TradingView.
With Stellar’s RSI now below the key midpoint of 50 and approaching the oversold threshold, the current reading of 38.99 suggests that sellers are gaining control.
While it’s not yet in oversold territory, it does signal weakening buying pressure and increasing downside risk.
If the RSI continues to fall, XLM could face further price declines unless buyers step in soon to stabilize the trend and prevent a slide into more deeply oversold levels.
Stellar CMF Heavily Dropped Since April 1
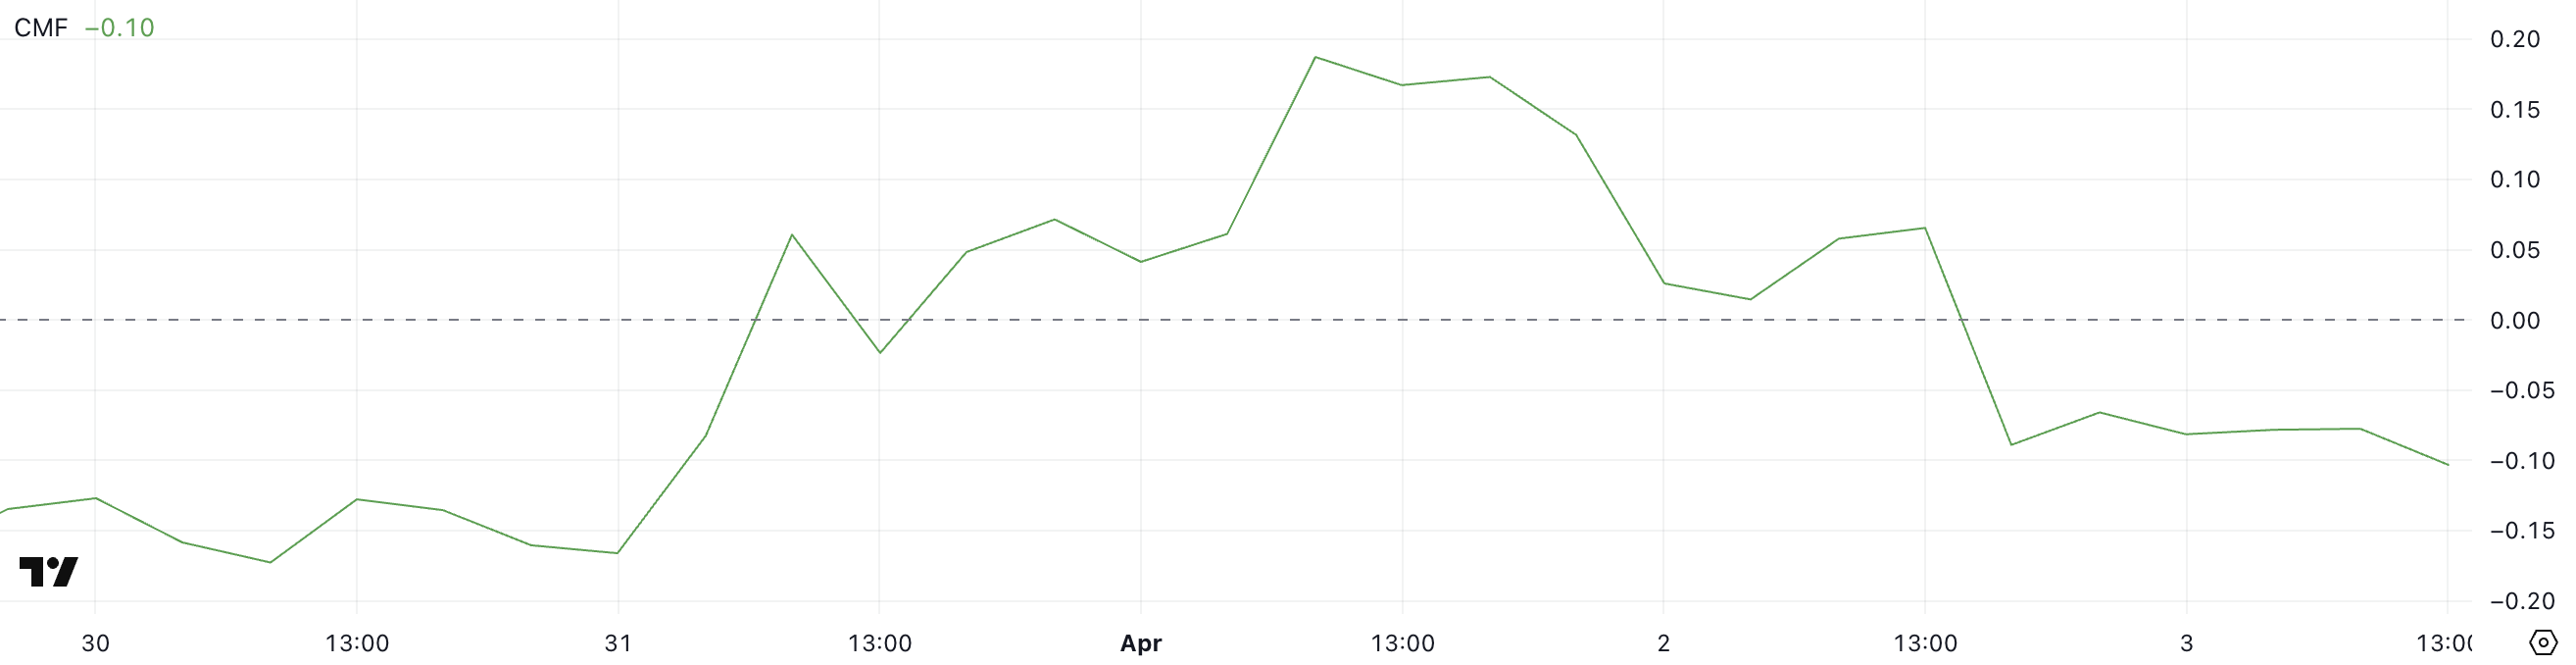
Stellar’s Chaikin Money Flow (CMF) has plunged to -10, a sharp decline from 0.19 just two days ago, signaling a significant shift in capital flow dynamics.
The CMF is an indicator that measures the volume-weighted average of accumulation and distribution over a set period—essentially tracking whether money is flowing into or out of an asset.
Positive values suggest buying pressure and accumulation, while negative values point to selling pressure and capital outflow.
 XLM CMF. Source:
TradingView.
XLM CMF. Source:
TradingView.
With XLM’s CMF now deep in negative territory at -10, it indicates that sellers are firmly in control and substantial capital is leaving the asset.
This level of negative flow can put downward pressure on price, especially if it aligns with other bearish technical signals. Unless buying volume returns to offset this outflow, XLM could continue to weaken in the near term.
Will Stellar Fall To Five-Month Lows?
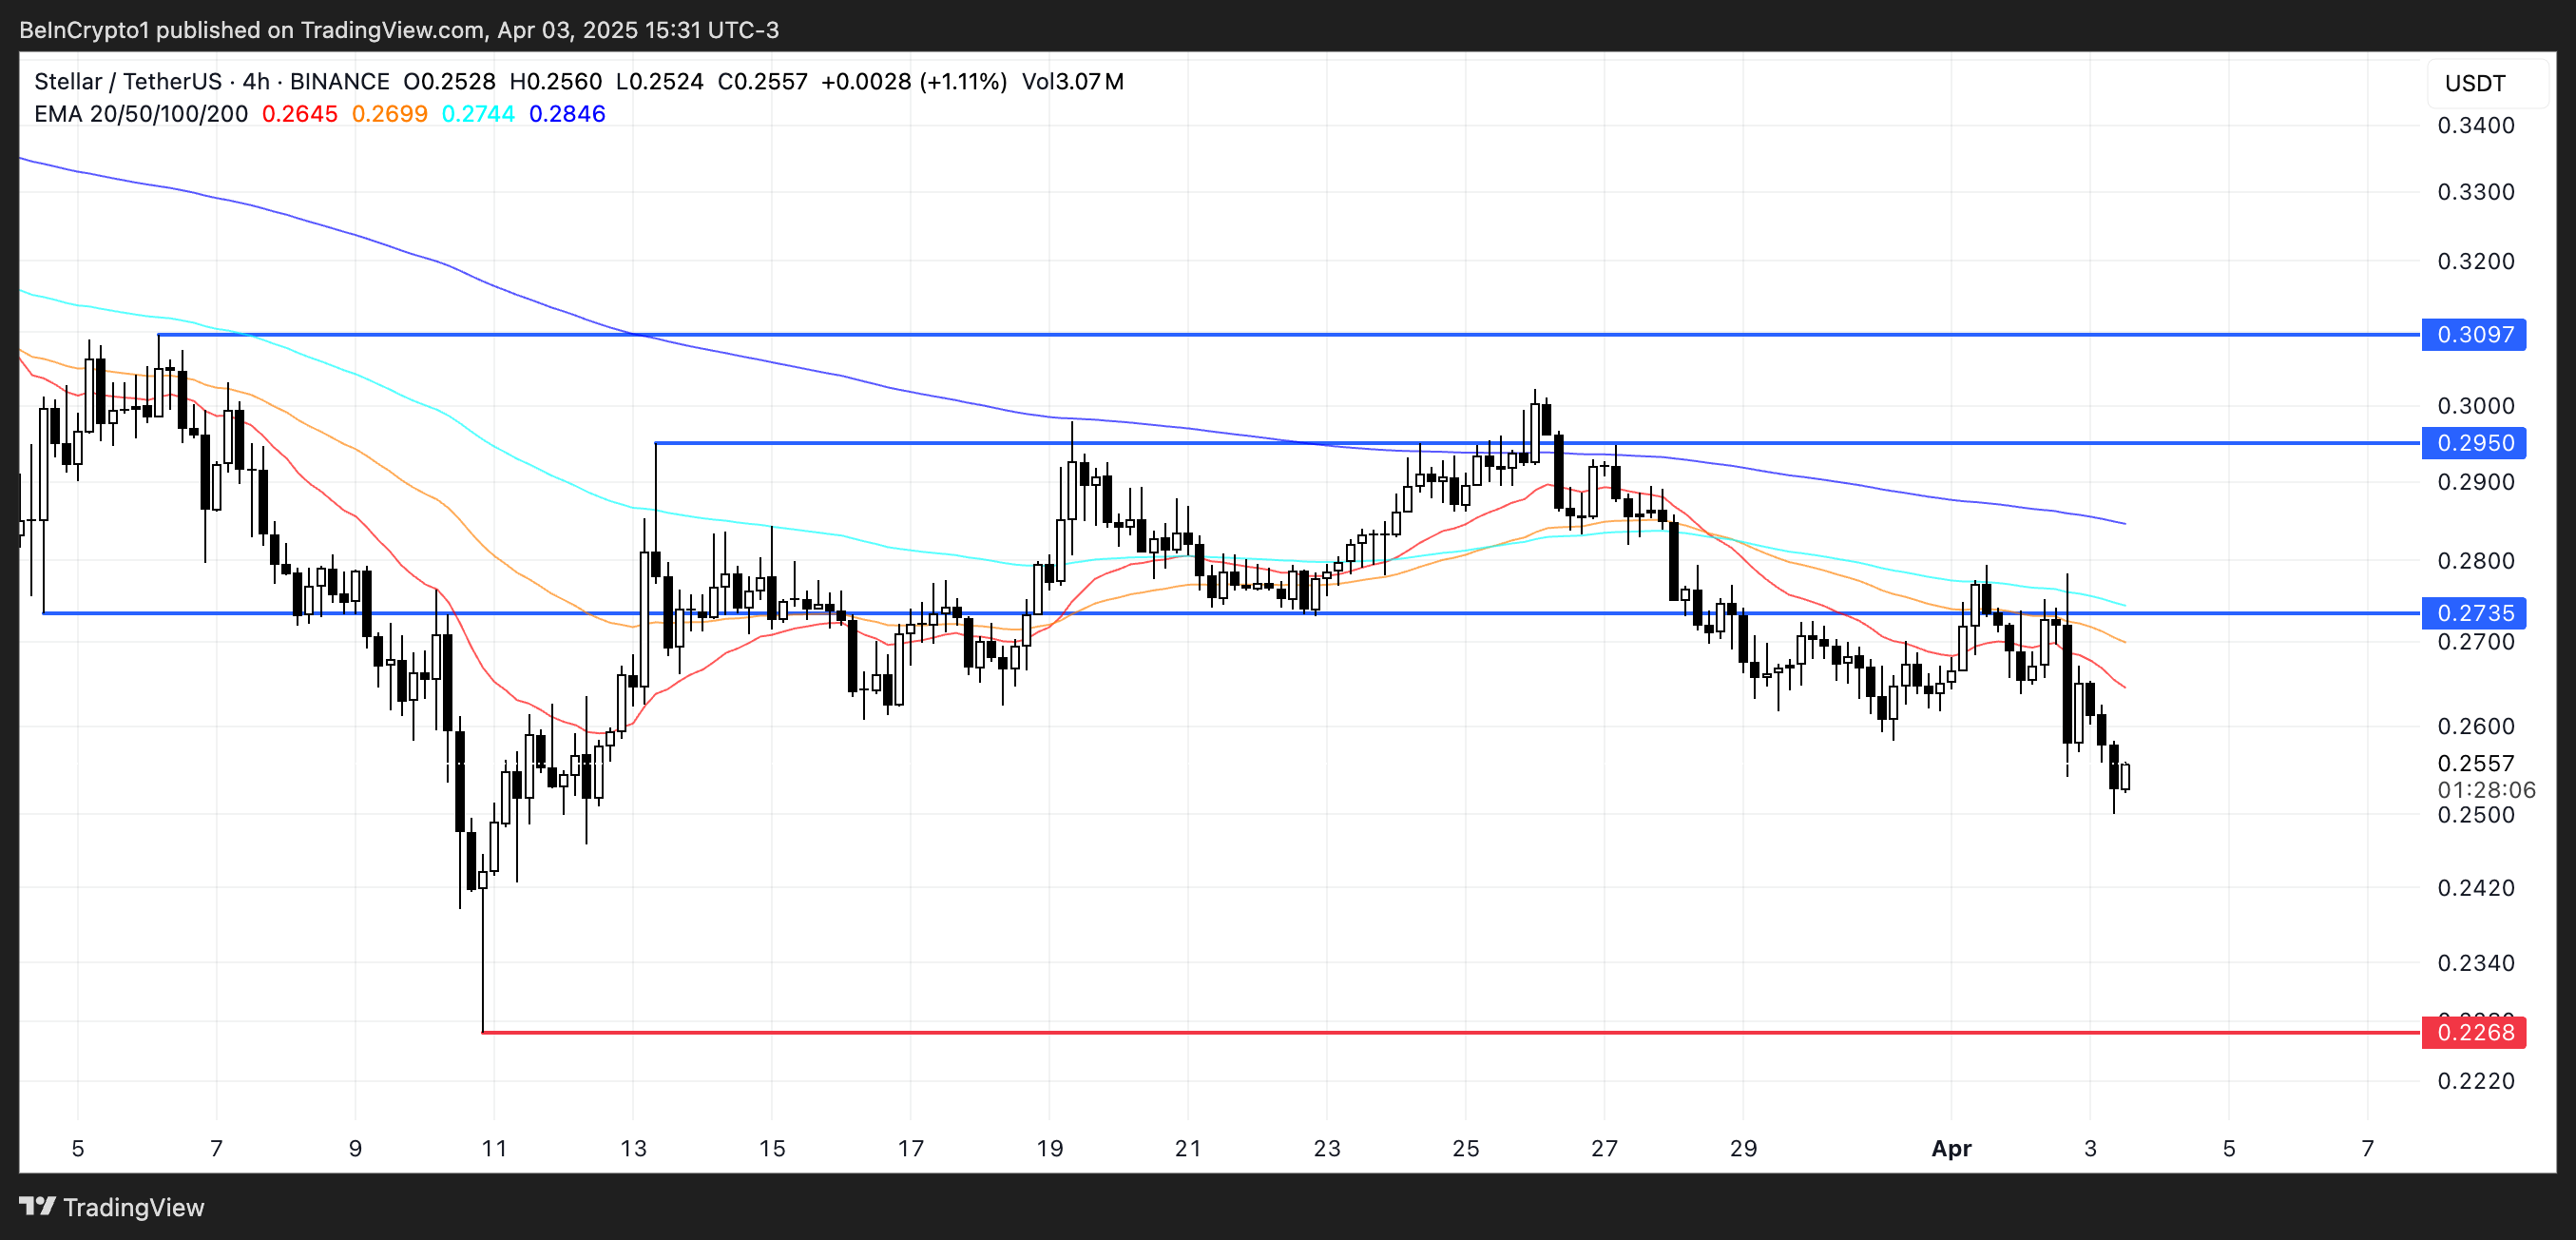
Stellar price action presents concerning signals as EMA indicators point to a strong bearish trend with significant downside potential.
Technical analysis suggests this downward momentum could push XLM to test critical support around $0.22. It could breach this level and fall below the psychologically important $0.20 threshold—a price not seen since November 2024.
This technical deterioration warrants caution from traders and investors as selling pressure appears to be intensifying.
 XLM Price Analysis. Source:
TradingView.
XLM Price Analysis. Source:
TradingView.
Conversely, a trend reversal scenario would require a substantial shift in market sentiment. Should bulls regain control, XLM could challenge the immediate resistance at $0.27, with further upside targets at $0.29 and the key $0.30 level.
However, this optimistic outlook faces considerable obstacles, as only a dramatic sentiment shift coupled with the emergence of a powerful uptrend would enable such a recovery.
Until clearer bullish signals manifest, the prevailing technical structure continues to favor the bearish case.
Disclaimer: The content of this article solely reflects the author's opinion and does not represent the platform in any capacity. This article is not intended to serve as a reference for making investment decisions.
You may also like
Can XRP Still Make You a Millionaire? Price Dips But Hope Surges

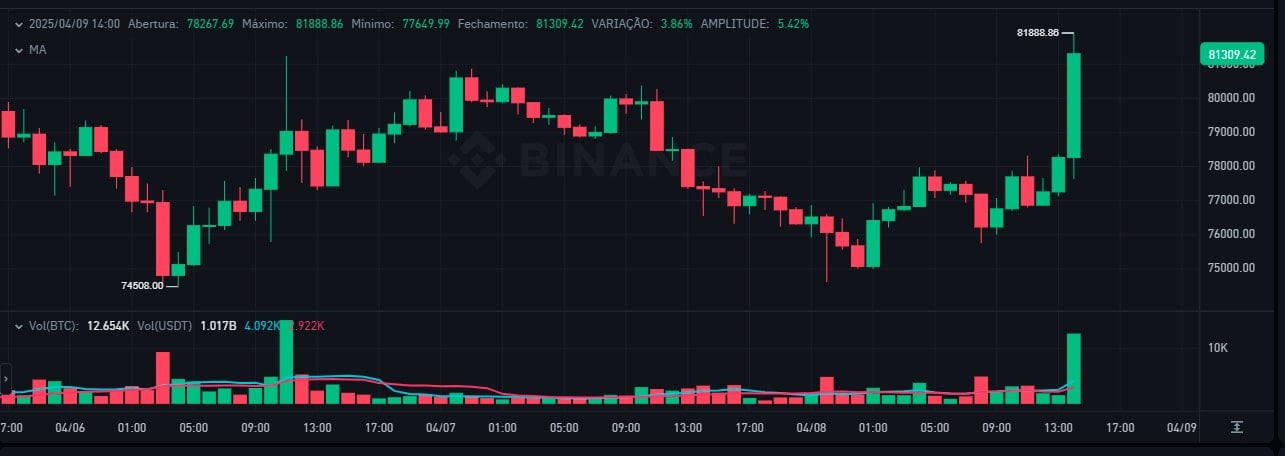
Bitcoin and S&P 500 explode over 7% after Trump's 90-day tariff pause
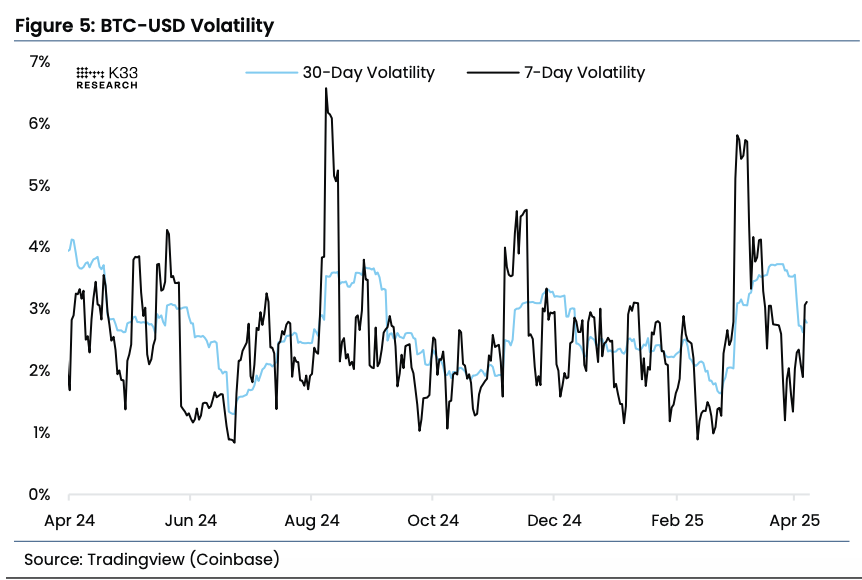
BTC volatility over the past week is slightly above yearly average: K33
There are signs of cautious optimism in the crypto markets for now
Teucrium XRP ETF sees $5M volume on debut despite tough market conditions