On-Chain Whale Tracking: Accumulation or Distribution?
As the oracle's flagship, a top cryptocurrency by market capitalization, Link has on-chain data far richer than what we have seen with ENA or PEPE.
Original Article Title: "Link Whale Behavior - Who's Buying, Who's Selling? Data Reveals the Truth!"
Original Article Author: Murphy, On-Chain Data Analyst
After receiving comments from friends in the community, requesting an analysis of Link's data, as the leader in oracles and a high market cap altcoin, Link's on-chain data is much richer than what we have seen with ENA or PEPE. Due to my lack of in-depth research into the project's technical ecosystem, I can only approach this from a data perspective and cannot provide a comprehensive research report.
Alright, in this edition, let's talk about Link. Our starting point is Link's large wallets; observing whale behavior is a key focus of on-chain data analysis. For Link, we must also face the reality that whales have already conducted large-scale profit-taking from December 2024 to January 2025.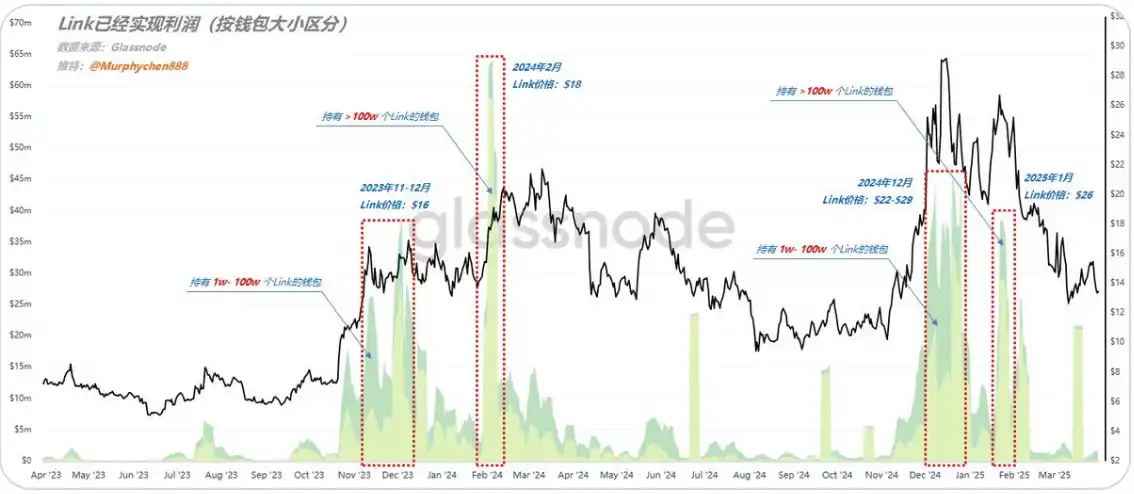
(Figure 1)
As shown in Figure 1, every time the Link price experiences a rapid increase, wallets holding 10k to 1M Link (high-net-worth group) and wallets holding>1M Link (whale group) both see very high peaks of realized profits. Additionally, in each major trend, the 10k to 1M group tends to sell off in large volumes first, followed by the>1M group starting to cash out, leading to a subsequent price peak and decline.
For example:
1. In November-December 2023, the trend was led by the 10k to 1M group, with Link priced around $16; in February 2024, the trend was led by the>1M group, with Link priced around $18;
2. In December 2024, once again, the trend started with the 10k to 1M group cashing out intensively at Link prices between $22-$29; subsequently, in January 2025, the>1M group started cashing out intensively, with Link priced around $26.
It is evident that these sell-offs occurred near interim highs. When the market cannot absorb such a large distribution of chips, a peak naturally forms.
(Figure 2)
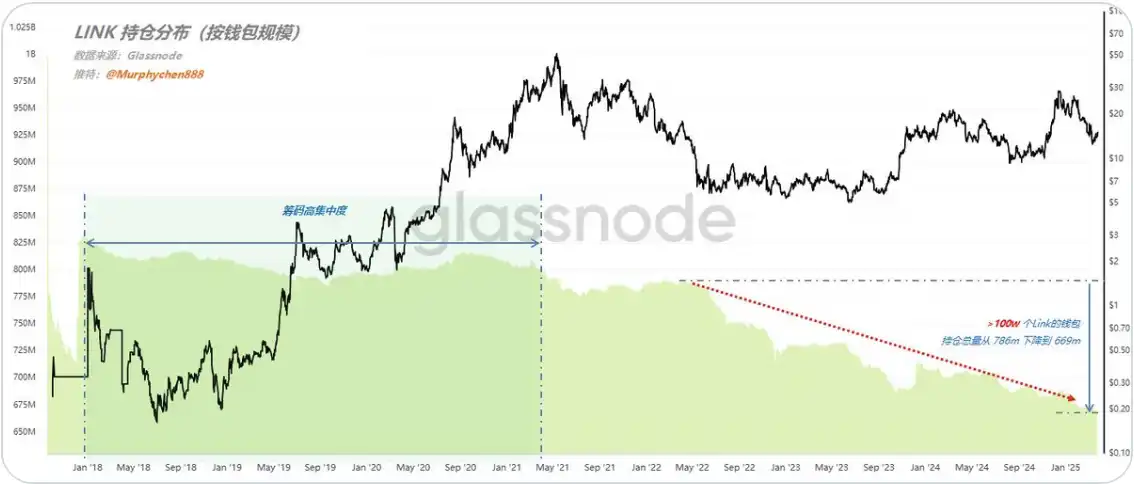
Looking at the current distribution of circulating chip holdings, the amount of Link held by whales (>1M) is steadily decreasing. In the bear market of May 2022, whales held 786m Link, and by March 2025, this number had decreased to 669m. This indicates that more Link is moving to relatively smaller wallets, meaning chip concentration is decreasing.
Looking back at historical data, from 2018 to 2021, Link was in a high chip concentration phase. After May 2022, the chip concentration has been on a declining trend, and it is unknown whether this means that Link is gradually transitioning from the previous "strong market maker control" mode to a "community consensus" mode.
(Figure 3)
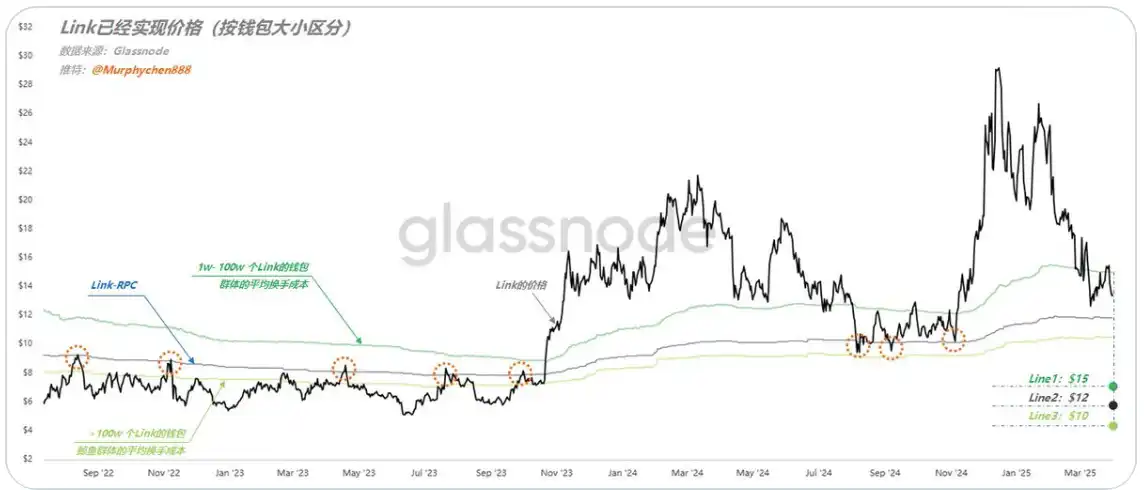
The three lines in Figure 3 represent:
1. Line1 (deep green) - Average turnover cost of the high net worth group; currently at $15;
2. Line2 (black) - Link-RPC, i.e., overall chip average turnover cost; currently at $12;
3. Line3 (light green) - Average turnover cost of the whale group; currently at $10;
The current Link price is below Line1 but above Link-RPC, indicating that there are still a significant number of chips in a floating profit state, keeping the overall turnover cost above the average. In this respect, Link outperforms the data performance of most altcoins. For example, as we saw in the previous period with ENA, the current price is already below ENA-RPC.
During the bear market consolidation phase, the price of Link has always been below Line3, meaning that at this time, the whale group is on average in a floating loss state, and each rebound encounters resistance at the Link-RPC line. When the price rises above Line1, it means that Link has sounded the horn of the bull market's major uptrend.
From August 2024 to November, Link also experienced a long bull market retracement period. It can be seen that the price has always remained above Line3, so whenever it touches the whale group's cost line, the selling pressure decreases. Therefore, if we assume that this bull market cycle has not yet ended, when the Link price is below Link-RPC but above Line3, it may be the limit of the retracement ($10-$12).
Once the price falls below Line3 and the rebound cannot break through Link-RPC, there is a risk of entering a long-term bear market.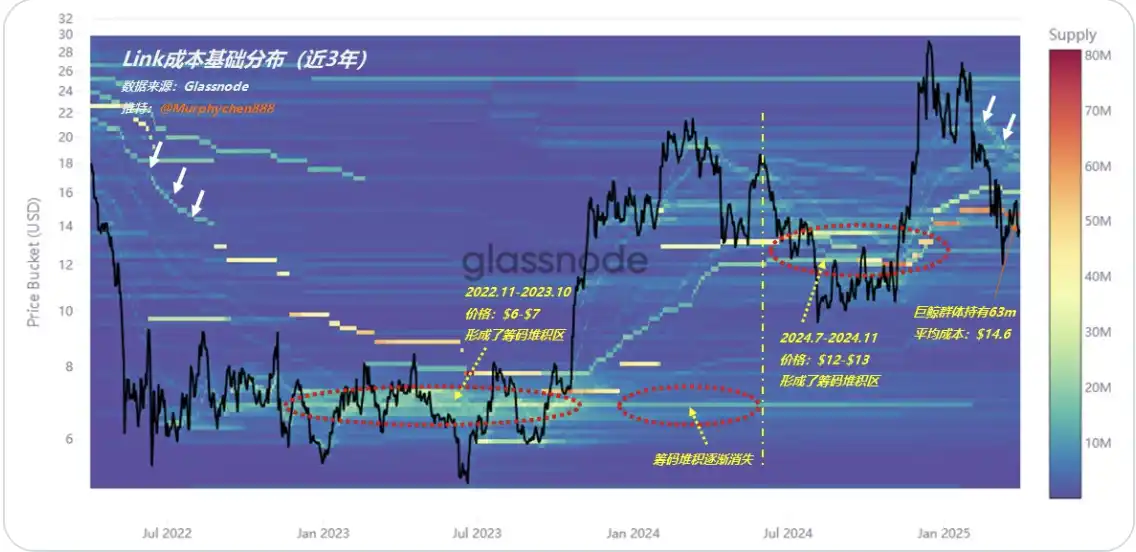
(Figure 4)
Finally, let's take a look at the chip structure changes of Link in the past three years and recently. During the consolidation period from November 2022 to October 2023, a large chip accumulation zone was formed around $6-$7. By March 2024, when the Link price surged to $20, this chip accumulation zone gradually disappeared, indicating that the chips accumulated at the lower levels were gradually sold off at the higher levels.
Afterwards, following a price retracement in July 2024 to November 2024, LINK continued to consolidate, forming a new accumulation zone with an average cost of around $12-$13. A portion of these holdings were gradually sold off as the price surged to $26-$28 between December 2024 and January 2025.
However, two whale groups' positions are worth noting: one group accumulated 39 million LINK around October 2024 at a cost of around $12, while another group also accumulated 17 million LINK around November 2024 at a similar cost. Regardless of the price surging to $28 and then dropping back to $12, these two whale groups did not sell their holdings; instead, they continued to accumulate at different times.
The former group increased their holdings in a phased and rhythmic manner; they added substantially to their position in December 2024 (at prices of $17 and $26), January 2025 (at $25), and significantly increased their holdings after the bounce from $12 on March 15, 2025. They currently hold a total of 66 million LINK with an average cost of $14.6;
The latter group consistently increased their holdings; they added to their position in December 2024 to January 2025 (as the price dropped from $29 to $19), February 2025 (as the price dropped from $25 to $14), and at the low point on March 11, 2025. They currently hold 21 million LINK with an average cost of $16.
This behavior indicates that these whale groups are patient long-term holders unlikely to sell at the current price level. Therefore, the $14.6 and $16 levels are not resistance but rather chip support. If the LINK price continues to decline, it is possible that these two whale groups may continue to accumulate.
Combining the aforementioned information, with Line 1 at $15 and Line 3 at $10, the collective accumulation by whale groups suggests that any pullback in the LINK bull market is likely to find a temporary bottom within that range.
My sharing is for learning and communication purposes only, not as investment advice
Disclaimer: The content of this article solely reflects the author's opinion and does not represent the platform in any capacity. This article is not intended to serve as a reference for making investment decisions.
You may also like
Numeros Motors Launches NFT Rewards for EV Buyers with polygon
Indian Crypto Trader Faced 78% Tax Penalties for P2P Transactions
Hackers are targeting Australia’s largest pension funds
Share link:In this post: Hackers targeted major Australian superannuation funds, stealing $500,000 from a few accounts and exposing personal data. Authorities and financial institutions are responding to the breach, urging members to check accounts and update passwords. Credential stuffing using stolen passwords is suspected in the attacks, prompting warnings to use unique logins and enable multifactor authentication.
