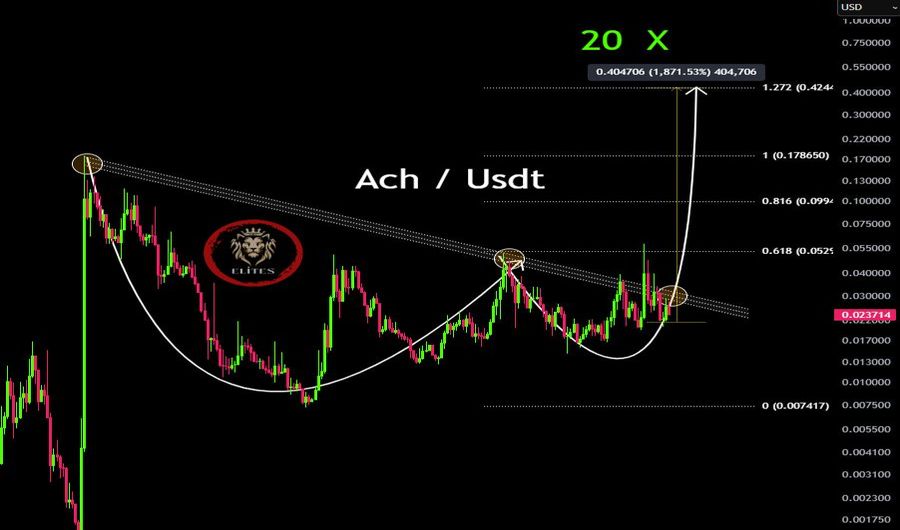
ACH forms a bullish pattern as key resistance levels signal a potential breakout
- ACH tests key resistance at $0.052, with a breakout potentially driving a strong bullish rally ahead.
- Rising volume and strong momentum reinforce the inverse head and shoulders breakout signal for ACH traders.
- Fibonacci projections indicate a potential surge to $0.424 if resistance levels are decisively broken in the near term.
The Alchemy ACH/USDT trading pair is displaying a significant technical setup, signaling a potential breakout. Price movements have formed an inverse head and shoulders pattern, a bullish signal that traders closely watch.
Market Momentum and Key Resistance Levels
The market is attempting to break through a downtrend line that previously acted as resistance. There could be a breakout as a result of excessive buying pressure , as indicated by rising trading volume at this point.
The ACH/USDT pair is trading at approximately $0.0237 as per market conditions. The chart displays a solid resistance area at about $0.052, which is the 0.618 Fibonacci retracement level. In case the resistance is broken, the second target stands at $0.099, which is the 0.816 Fibonacci level. Upside expectations also extend to the 1.272 Fibonacci extension at $0.424, for a potential 1,871.53% price appreciation.
Technical Indicators and Breakout Potential
A detailed technical analysis from Crypto Elites reveals a structured price movement toward higher resistance levels. Fibonacci retracement levels highlight potential price points, with $0.1786 acting as an intermediate resistance before reaching the upper price targets.

Source: CryptoELITES
Historical price data shows multiple rejections at the descending trendline, leading to temporary pullbacks before a renewed attempt at breaking resistance. Increased trading volume near these levels suggests growing investor confidence in a bullish breakout. The curved trajectory in the chart suggests a cup and handle formation, often associated with strong upward momentum.
Future Price Outlook and Risk Factors
Insights from market analyst Crypto Elites indicate a possible surge toward the $0.445 level if the breakout occurs. The chart’s “20X” label emphasizes the potential for substantial returns if price targets are reached.
The lowest Fibonacci level of $0.0074 represents the base support, where previous price action found stability. The symmetrical structure in the price movement suggests a prolonged consolidation phase before a decisive price shift.
If resistance is broken, ACH/USDT could experience rapid gains with minimal resistance toward higher Fibonacci extensions. This analysis focuses on historical price trends, Fibonacci retracement levels, and market structure without accounting for external economic factors or fundamental influences.
Disclaimer: The content of this article solely reflects the author's opinion and does not represent the platform in any capacity. This article is not intended to serve as a reference for making investment decisions.
You may also like
Invest Smart: 4 High-Potential Altcoins for Massive Returns This Year
Russia Addresses US Tariff Threats as BRICS Ramps up Dollar Escape Plan
Ripple Lawsuit News: Ex-SEC Lawyer Reacts to Unusual XRP Filing by $10M Fined Stock Dealer
