Pepe (PEPE) Gains Momentum With Key Breakout Retest: Is a Recovery Rally Ahead?

Date: Tue, April 01, 2025 | 09:15 AM GMT
The cryptocurrency market has kicked off Q2 on a positive note after enduring a record-breaking bearish Q1. Ethereum (ETH) declined by over 44% during the first quarter, dragging most altcoins and memecoins to multi-month lows.
Among the affected memecoins, Pepe (PEPE) also faced significant pressure, losing over 60% of its value over the last 90 days. However, today, with the jump of 5% in ETH, PEPE is showing signs of a potential rebound as it surges by over 10% after its recent breakout and successful retest.
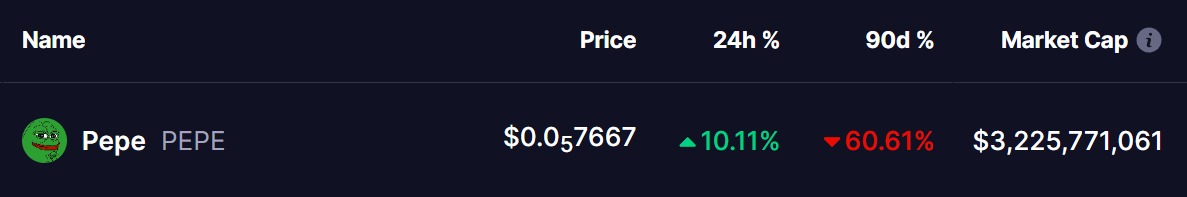 Source: Coinmarketcap
Retests Falling Wedge Breakout
On the daily chart, PEPE saw an impressive 265% rally in November 2024. However, following that uptrend, the price entered a correction phase, forming a falling wedge pattern, which led to an 80% drop to a low of $0.0000052. This level acted as a strong support zone where buyers stepped in to push the price higher.
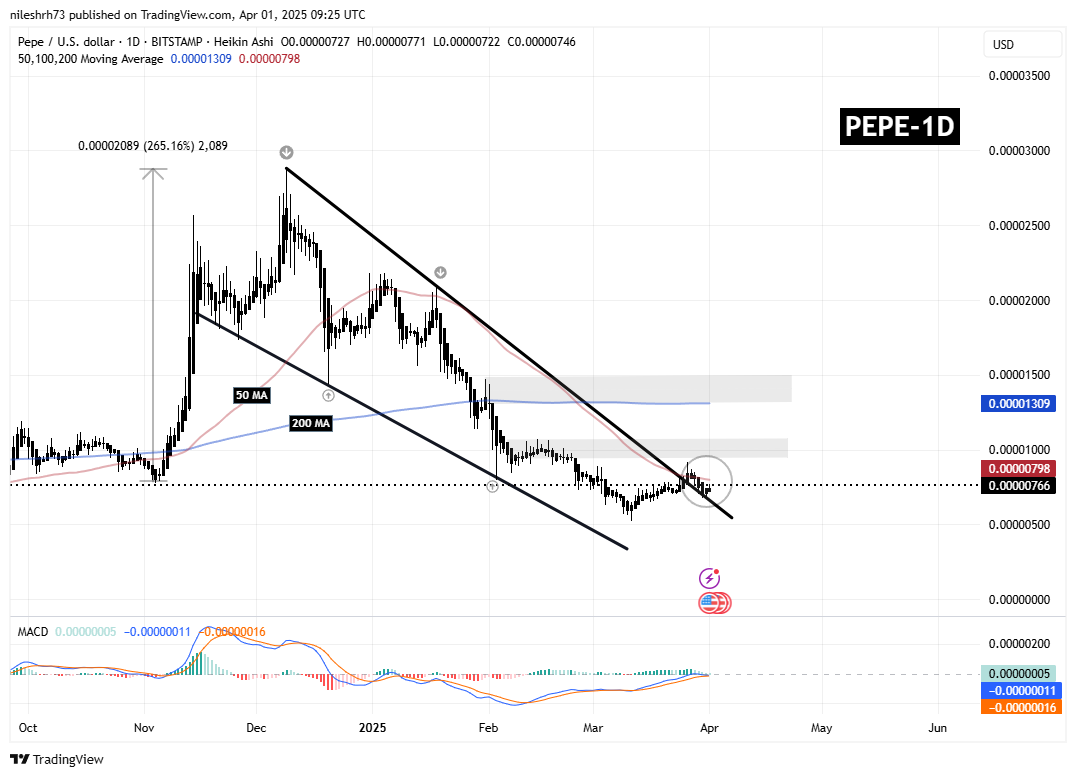 PEPE Daily Chart/Coinsprobe (Source: Tradingview)
Recently, PEPE made a significant breakout, surpassing the descending trendline of the falling wedge at $0.0000079 and reached a short-term high of $0.00000918 before pulling back due to market-wide volatility. This retracement brought PEPE back to the breakout trendline at $0.0000070, where it successfully held support and is now gaining momentum, trading at $0.0000076.
From here, the confirmation of this falling wedge breakout with a successful retest strengthens the foundation for further gains. A move above the immediate resistance at $0.00001072 will be crucial for PEPE’s bullish outlook. A breakout above this level could open doors for a rally toward the 200-day moving average and the $0.00001475 price zone, representing a potential 91% increase from current levels.
Is a Recovery Rally Ahead?
The MACD indicator is showing signs of a bullish crossover, suggesting that selling pressure might be easing. If the momentum strengthens, it could confirm a shift towards a recovery phase.
Disclaimer: This article is for informational purposes only and not financial advice. Always conduct your own research before investing in cryptocurrencies.
Disclaimer: The content of this article solely reflects the author's opinion and does not represent the platform in any capacity. This article is not intended to serve as a reference for making investment decisions.
You may also like
Muxy AI Overview

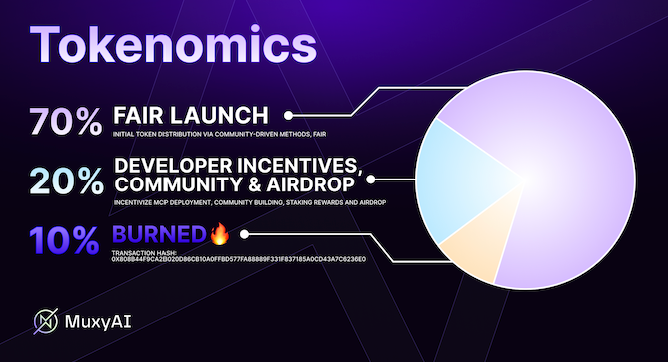
MAI Tokenomics
SHM is live! Bullish or bearish? Join to share 3,360 SHM!

MYX Finance Hits Big: 30,296% Oversubscription on CEX Wallet, $51.31M Trading Volume, and Listed on Bitget