NEAR and GRT Approach Falling Wedge Resistance – Could Breakouts Spark a Recovery?

Date: Sun, February 23, 2025 | 06:47 PM GMT
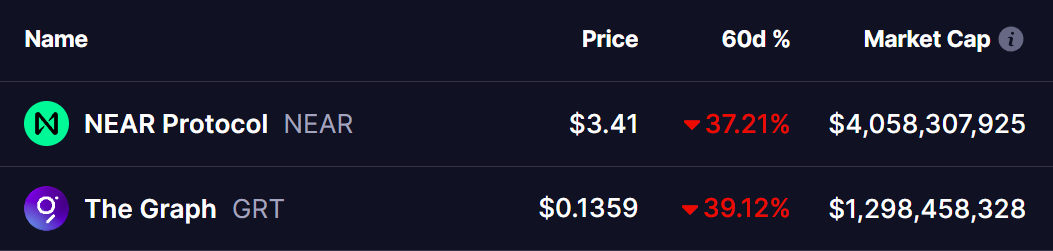
In the cryptocurrency market this week, major altcoins are showing mixed signs of recovery after facing a significant correction over the past 60 days.
Among the impacted altcoins, two AI Tokens, Near Protocol (NEAR) and The Graph (GRT), have corrected over 35% in the last two months. Both assets are now testing key resistance, and technical indicators suggest a possible reversal could be in play.
 Source: Coinmarketcap
Near Protocol (NEAR)
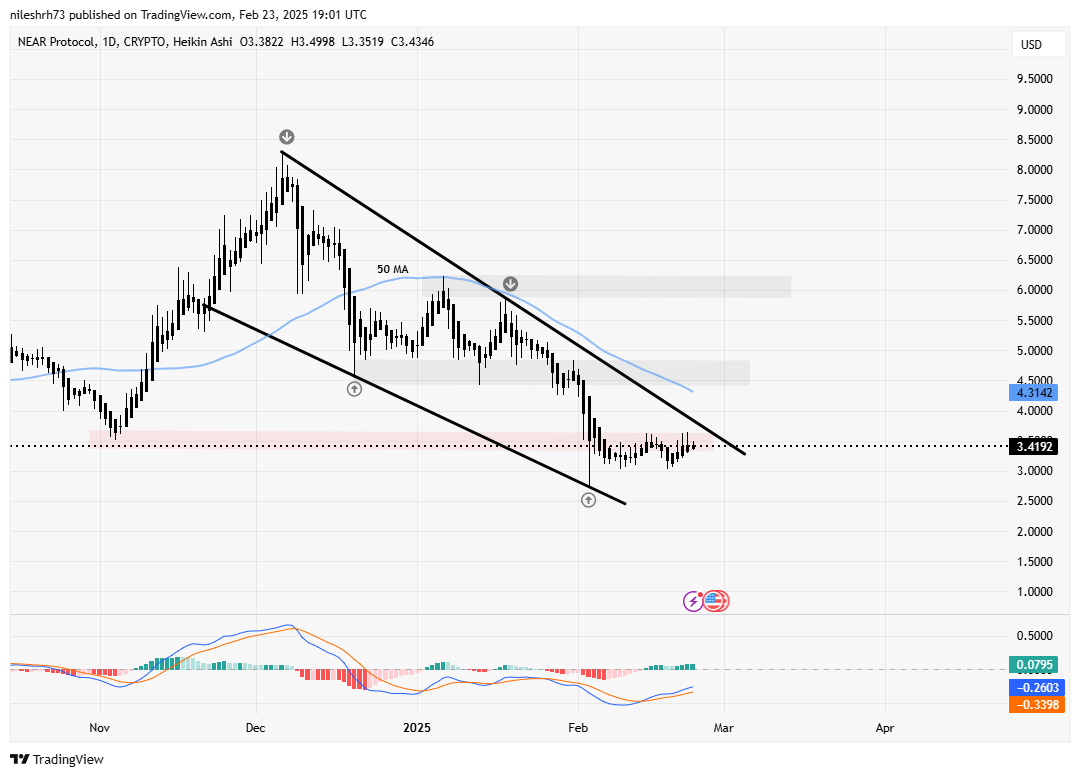
NEAR’s daily chart highlights a falling wedge pattern that formed after a sharp rejection from the December 6 high of $8.24. The correction saw NEAR plummet to a low of $2.72, where it tested the lower trendline of the wedge.
 Near Protocol (NEAR) Daily Chart/Coinsprobe (Source: Tradingview)
However, NEAR has now rebounded to $3.41 and is inching towards the upper resistance of the wedge. If the price breaks out and successfully retests this wedge, the next key resistance lies at the 50-day moving average (MA).
A successful move beyond this level could push the price towards the next resistance levels of $4.51 and $6.22, representing an 81% potential upside from the current price.
The Graph (GRT)
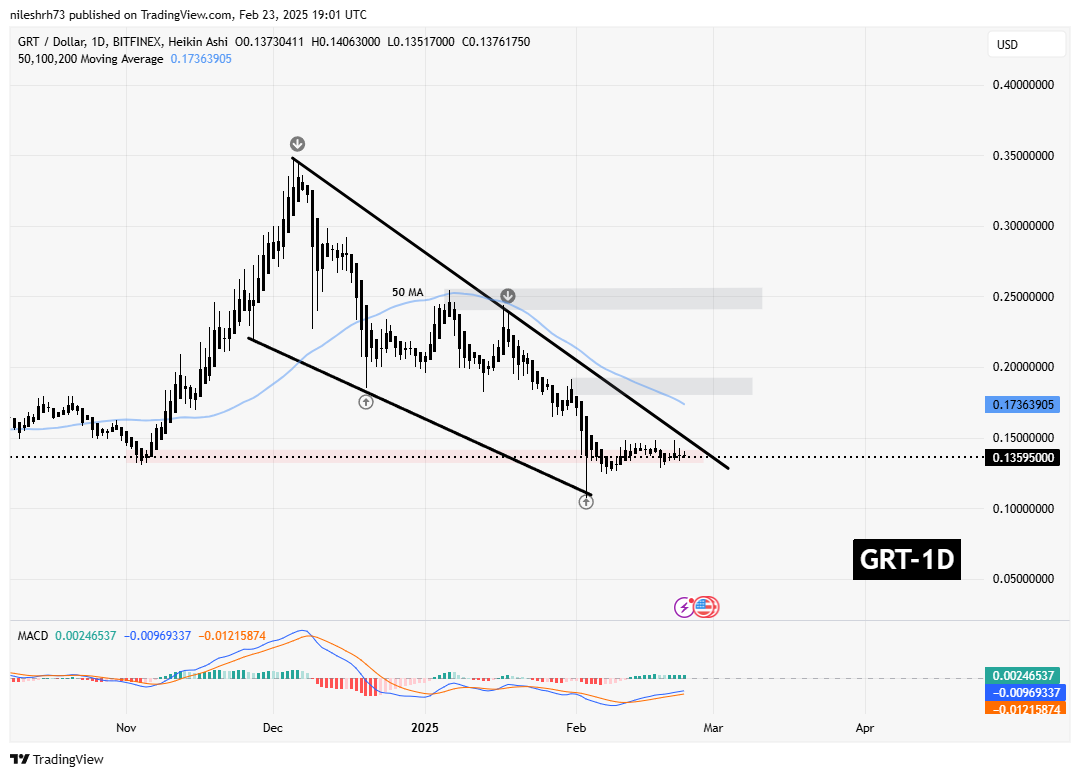
The Graph (GRT) is also following a similar falling wedge pattern to NEAR, which formed after a sharp rejection from the December 5 high of $0.34838. The correction saw GRT plummet to a low of $0.078, where it tested the lower trendline of the wedge.
 The Graph (GRT) Daily Chart/Coinsprobe (Source: Tradingview)
However, GRT has now rebounded to $0.135 and is approaching the upper resistance of the wedge. If the price breaks out and successfully retests this wedge, the next key resistance lies at the 50-day MA.
A decisive move beyond this level could propel the price towards the next resistance levels of $0.19 and $0.24, representing a 74% potential upside from the current price.
Final Thoughts
Both NEAR and GRT are demonstrating resilience at their respective resistance levels, hinting at the possibility of a trend reversal. The MACD indicator is showing early signs of bullish momentum, with the signal line converging towards a crossover. However, their next moves will largely depend on the broader market conditions, particularly Ethereum (ETH) and Bitcoin (BTC) dominance.
Disclaimer: This article is for informational purposes only and does not constitute financial advice. Always conduct your own research before investing in cryptocurrencies.
Disclaimer: The content of this article solely reflects the author's opinion and does not represent the platform in any capacity. This article is not intended to serve as a reference for making investment decisions.
You may also like
Shibarium Devs Connect with Core Team via New Channel

Bitcoin Clings to $74K: Analyzing BTC’s Ability to Ward Off Further Decline
Stability at $74K: How 50,000 BTC Holders are Supporting Bitcoin's Resistance Against Further Dips

Donald Trump’s Memecoin to Face $320 Million Token Unlock as Price Dips

33% of French looking to buy crypto in 2025 but Italians are even more bullish
Share link:In this post: A third of French people intend to purchase cryptocurrencies this year. New study shows Italians as most bullish among surveyed nations in Europe. The crypto sector’s growing legitimacy helps attract more investors, researchers say.